Unveiling Apple's Environmental Vision. A Patent Exploration. Part 2: Uncovering the Pattern

“Sometimes when you innovate, you make mistakes. It is best to admit them quickly and get on with improving your other innovations.” - Steve Jobs
In the realm of technology, few companies have left as profound an impact on the world as Apple Inc. With its cutting-edge products and groundbreaking innovations, the tech giant has continuously captured the imagination of millions. However, beyond its sleek devices and revolutionary software, Apple has also been quietly pioneering a commitment to environmental sustainability that often goes unnoticed. In this second part of our series, we delve into the depths of Apple's patent-history since 2000, focusing on the classification symbol Y02, to uncover the intriguing pattern of their environmental vision through the lens of the innovation S-curve.
The S-curve
The innovation S-curve is a widely recognised concept that illustrates the pattern of technological advancement over time. It depicts the initial slow progress, followed by rapid growth, and eventually reaching a plateau as the technology matures. This curve represents how innovations emerge, gain momentum, and then slow down as they approach their limits. An excellent example of the innovation S-curve can be observed in Apple Inc.'s technologies for mitigating climate change. In the early stages, Apple focused on basic sustainability efforts, such as energy-efficient hardware and recycling initiatives. These initial efforts led to gradual improvements but did not create significant impact at first.
However, as the urgency to address climate change increased, Apple rapidly accelerated its efforts and moved to the steep growth phase of the S-curve. The company introduced groundbreaking innovations like the transition to renewable energy sources for their data centres and corporate offices, as well as incorporating recycled materials into their products. These advancements represented a significant leap forward in their commitment to environmental sustainability. As Apple's sustainability initiatives reached a more mature stage, they might experience a slowing down of the growth rate, but in the process they shifted to a sustained higher level of innovation in this area, aspiring to make a positive impact on the environment. The innovation S-curve thus provides a helpful framework to understand the progression of technological advancements in mitigating climate change by companies like Apple Inc.
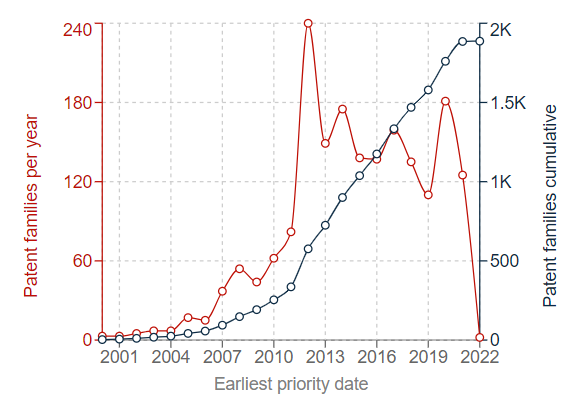
Notice that last year (2022), according to Espacenet, it would seem that Apple no longer originated patent families related to mitigation against climate change. That is because it takes some time for a patent application to be published. About 18 months or 1,5 year. At the time of writing this article (mid 2023), Patent families originating in the year 2022 are thus not yet publicly available and are thus not yet represented in this graph.
How to get the information
It's an interesting excercise to dig in Espacenet yourself. We'll continue from the situation in Part 1 of this series, where we searched all the patents from Apple Inc.
To open some filters in the Espacenet website, activate the "Filters" slider below the query input box of the website. This will open a filter-area where various options are possible for further refining the search results of your query. Navigate through the filter fields till you find the "Earliest priority date" item and click it. A little graph area will fold open allowing you to filter the search results. This graph shows info from back in '92 until today. We can filter the search results, for example by decreasing the relevant date range by editing the dates or manipulating the slider end points above the graph. This is illustrated in the screen recording below.
The red line represents the absolute number of patent families for each earliest priority year. In simple terms, this is the earliest year a patent was filed for a particular invention. The black line shows the cumulative count of patent families, in other words the sum of patent families accumulated from all the previous years within the selected range. The S-curve is clearly apparent in the shape of the graph of the patent families.
Whats next?
In Part 3 of this series, we'll dip our toes into this pool of patents, aiming to shed some light on what innovations illustrate the tech giant's commitment to sustainability.